
"Proof of Return on Investment Complete"
I took a break from my stock investment blog for about 3-4 months, and here's why:
- I thought posting 130 stock analysis articles in 4 months was too much.
- I needed "time" to see if the investment methods suggested on the blog actually yielded profits.
- My personal work life was busy.
Originally, I thought about letting it simmer for about a year, but I felt it was time to post again and look at the return statistics of the stocks I posted on the blog.
"Revealing Investment Return Results!"
The period of posting stock articles is about 4 and a half months. In fact, this was not a time when the composite stock price index was expected to rise significantly. It was a time of repeated ups and downs, creating turning points at the same level or falling.
Rather, I think it was a good time to buy good stocks.
Posting period of stock articles: '22.10.13~'23.02.02 (4 and a half months)
The assumptions of this analysis are as follows:
- Assume that all stocks were bought at the time of posting.
- Assume that the investment amount per stock is constant.
- When the investment return reaches 100%, take profit of 50% of the quantity (concept of principal recovery)
- Excluding commissions and taxes
The results are as follows:
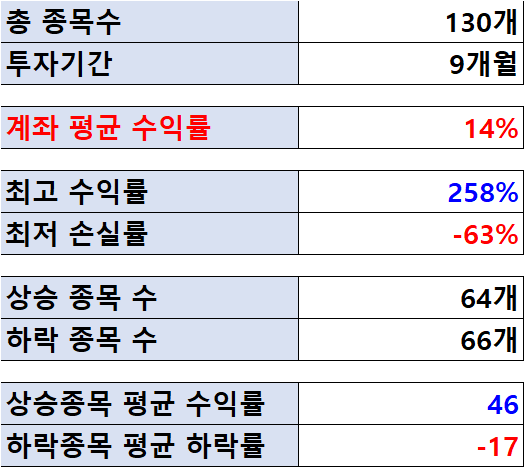
블로그에 종목게시글을 올린 이후로 9개월간(4.5개월 종목 게시글 올린기간 포함) 총 수익률 평가 결과, 전 종목을 매수하였을 경우 14% 계좌수익 예상
After posting stock articles on the blog, the total return evaluation for 9 months (including 4.5 months of posting stock articles) is expected to yield a 14% account return if all stocks were bought.
In fact, it's not a complete statistical result. There are still stocks that haven't started a significant rise, and there are many stocks in the (-) minus range. In other words, "time" is needed to produce a proper annual return statistic for the investment method I suggested.
The highest return was close to 300%, and the biggest loss was -60%, with some stocks being halved.
But the number of rising and falling stocks is similar. Is this strange?
"The key to making a profit is this!"
Why is the account profitable when the number of rising stocks and falling stocks is the same?
Looking at the graph below will make it a little easier to understand.
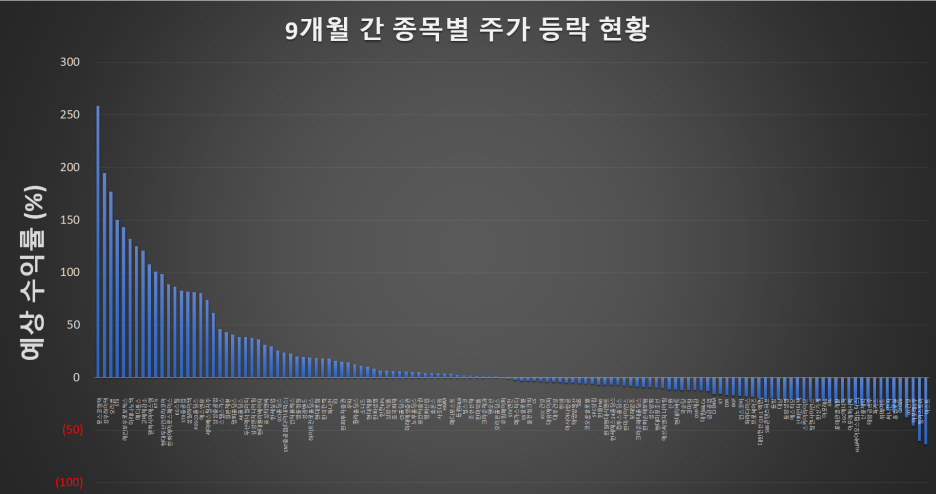
130개 종목의 '23년 7월 16일 현재 수익률 현황 (매수했다고 가정)
As time goes by, there is a difference in expected returns. It's not important how many profitable stocks and falling stocks there are, but how much higher the return rate of profitable stocks is compared to the fall rate of falling stocks.
In other words, as "time" passes, the return rate that exceeds the loss of falling stocks increases. Do you think that if you buy a lot of any stock, this result will come?
Does dividing eggs into an account always make a profit?
Then what is the reason?
The answer is very simple. "Because I only bought such stocks."
In simple terms, such stocks are the stocks posted on this blog, and I only selected stocks that were lingering in a very low price range. If these stocks don't go bankrupt, they have nowhere to go but up as time goes by. And even if you can't buy at the lowest bottom (you can't buy), they show some downward rigidity.
In my experience, the rise rate is +1000% (910 times) and the fall is -60-70% at most.
When stocks bought in a low price range gather, this result comes out. That's the account return rate, and it's a way that never collapses. It means that the stocks are holding each other and not going down.
"Readers' Challenge?"
- How can you buy and manage all those stocks?
The number of stocks should never be 130. This is a "virtual investment experiment" conducted to derive statistical results on investment methods.
I don't exceed 30 stocks. When I hold a lot, it's about 50. I just try to select stocks at a lower price more carefully.
If you blindly buy any of the 130 introduced stocks, a similar return rate (or even higher account return rate) will come out as "time" goes by.
The point is that if you trade these stocks for a lifetime, the profit will be on my side as "time" goes by, and you can live your daily life comfortably.
- Isn't a 14% account return rate too low?
As mentioned, the 9-month experimental period is absolutely not enough. Considering the investment period of 6 months to 5 years per stock, you should eat a sufficient return rate of at least 300%~1000%.
In my experience, the annual average account return rate is over 26%.
Try it for a lifetime. You will experience how the seed money grows with compound interest.
"Finishing the Return Rate Experiment...."
I don't know how many people will read this post as I've stopped posting for 4 months. However, I think it's not common to have a blog that shows not only simple stock information and news like other stock blogs, but also the essence of actual investment and the results of actual return experiments.
I will occasionally post stock analysis, but I don't plan to post "undercooked" stocks for experiments every day like before.
And I'm thinking of sharing the Excel file with the original 130 stocks used in this analysis, the expected purchase price, the current price, and the return rate for those who really desperately want it.
I'm thinking of deciding after seeing the message or private reply.
"투자 전략의 검증: 수익률의 진실"
본 보고서는 최근 4개월 동안 중단된 주식투자 블로그의 활동을 재개하며, 그 동안의 투자 전략의 효과를 검증하기 위한 목적으로 작성되었습니다. 이 기간 동안의 활동 중단은 다음과 같은 이유로 인해 발생하였습니다:
- 4개월 동안 130개의 종목을 분석하고 게시하였으며, 이는 과도한 양으로 판단되었습니다.
- 블로그에서 제안한 투자 전략이 실제로 수익을 가져다주는지 확인하기 위해 필요한 "시간"이 있었습니다.
- 개인적인 업무가 바빴습니다.
이 보고서는 투자 전략의 효과를 검증하기 위해, 블로그에 게시된 종목들의 수익률을 분석하였습니다.
"투자 수익률의 공개 및 분석"
분석 대상 기간은 약 4.5개월로, 이 기간 동안 주가지수는 크게 상승하지 않았습니다. 그러나 이 기간은 좋은 종목을 매수하기에 적절한 시기였다고 판단됩니다.
본 분석에서는 다음과 같은 가정을 하였습니다:
- 모든 종목을 게시된 시점에 매수했다고 가정합니다.
- 각 투자 종목에 대한 투자금은 일정하다고 가정합니다.
- 투자 원칙으로 수익률이 100%에 이르면 50%를 익절합니다(원금 회수 개념).
- 수수료와 세금은 제외합니다.
이는 완전한 통계 결과는 아닙니다. 아직 상승을 시작하지 않은 종목들도 있고, 손실을 보고 있는 종목들도 많습니다. 즉, 제가 제안한 투자 전략의 연간 수익률을 정확히 알기 위해서는 더 많은 "시간"이 필요하다는 것입니다.
"투자 전략의 핵심: 시간의 힘"
상승한 종목의 수와 하락한 종목의 수가 비슷하면서도 계좌가 수익을 보는 이유는 무엇일까요? 그것은 바로 '시간'의 힘입니다. 시간이 지날수록 수익률이 "내 편"이 되는 것입니다. 이는 투자 전략의 핵심입니다.
"투자자의 질의?"
- 그 많은 종목을 어떻게 다 사고 관리할 것인가?
절대로 종목의 수가 130개가 되어서는 안됩니다. 이것은 투자 전략의 통계적 결과를 도출하기 위한 "가상의 투자 실험"입니다. 실제로는 종목 수를 30개로 제한하며, 신중하게 더 낮은 가격의 종목을 선택하려고 노력합니다.
2. 계좌 수익률 14%는 너무 낮은 것 아닌가?
언급했듯이, 9개월의 실험 기간은 충분하지 않습니다. 종목당 6개월에서 5년까지의 투자 기간을 고려해야 충분한 수익률, 즉 최소 300%~1000%를 얻을 수 있습니다.
"결론: 투자 전략의 검증"
이 보고서는 투자 전략의 효과를 검증하고, 실제 수익률을 공개하는 데 목적이 있습니다. 이는 투자자들에게 투자의 본질을 이해하고, 실제 수익률을 경험할 수 있는 기회를 제공합니다. 이를 통해 투자자들은 자신의 투자 전략을 개선하고, 더 나은 투자 결정을 내릴 수 있을 것입니다.
'국내주식 (Korean Market)' 카테고리의 다른 글
| 성우하이텍 "시세를 다한 것인가?" (자동차 차체, 부품배터리팩, 전기차, 수소차, 자율주행 센서) (2) | 2023.07.20 |
|---|---|
| 세아베스틸지주 목표주가는 채우고, 방향은 어디로? (1) | 2023.07.18 |
| [AK홀딩스] 줄 때 먹는 것이다. 잠시 쉬어가는 타이밍 포착! (1) | 2023.03.24 |
| [안랩 주가] 안랩은 어떻게 수익을 내야할까? 안철수 관련주 (0) | 2023.02.21 |
| [한화투자증권 주가 10배 시세를 향해] 윤석열 쓴소리에 은행주, 증권주 신규 공개 채용, 현대자동차 10년만에 생산직 정규직 공개채용 잘한 일! (0) | 2023.02.20 |


